Metrovision's Multifocal ERG and VEP
- Home
- Visual function tests
- Vision electrophysiology
- Multifocal ERG and VEP
Principle
This exam creates a map of electrical responses from the retina (mfERG) or from the visual cortex (mfVEP).
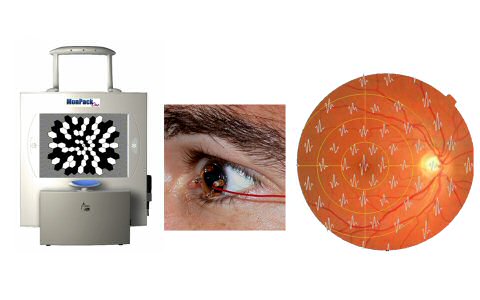
The visual stimulator generates a matrix of 16 to 217 zones that are stimulated
with independent sequences of flashes. The global ERG response (or VEP) is recorded from a unique electrode.
Local responses are obtained by computing the inverse correlation between this global ERG response and the stimulation sequence.
Highly innovative stimulation technology
Controlling stimulus luminance and timing is very important for multifocal exams
This is achieved thanks to the proprietary LED technology of the MonPackONE.
It produces very high luminance stimulations (up to 600 cd/m2) resulting in responses of high signal to noise ratio
and reduced examination time
The LED backlight produces short flashes of light interespaced with dark intervals, resulting in a timing accuracy better
than 1 ms.

Multifocal stimulations
A compromise needs to be made between resolution, examination time and signal/noise ratio.
The number of stimulation zones is comprised between 19 and 217.The number of stimulated zones must be a compromise since, as this number increases, the accuracy of fixation and the recording time increase. For 61 stimulation zones, the typical recording time varies from 60 to 300 seconds, depending on the cooperation of the patient.

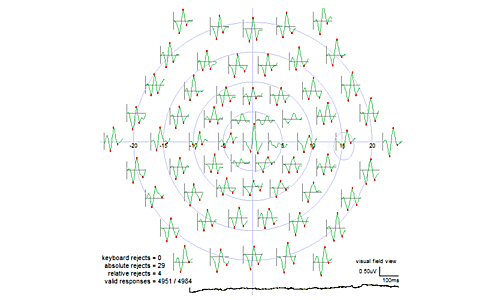
Map of local responses
During the exam, the program displays in real time the local responses with an automated identification of the N1, P1 and N2 peaks of each response.
The quality of the recorded signal is evaluated by computing the noise level and displaying the signal evolution since the beginning of the recording (base line).
In the example hereby, the base line appears very unstable at the beginning of the exam, which is frequently due to eye movements, eye blinks or electrode instability.
After about 1 minute, the baseline becomes stable and the noise level indicates that the quality of result is sufficient for a valid interpretation.
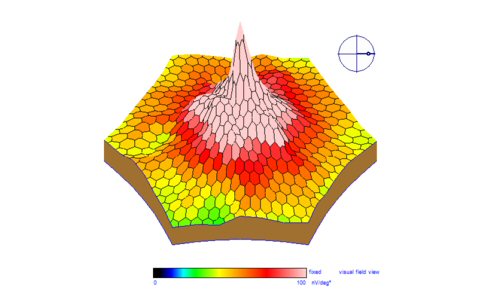
2D and 3D maps
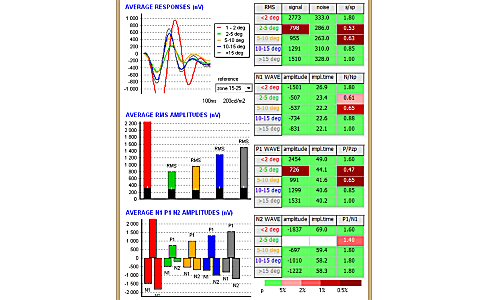
The program allows to display 2D and 3D interpolated maps of the amplitude and implicit time of the N1, P1 and N2 peaks of the local responses.
Statistical analysis
The ring ratio analysis greatly improves the detection of early alterations.
The program performs a comparison of analysis results within given zones with a normal subjects data base from several clinical centers.
Quantitative measurements of amplitude and implicit times outside the normal range are immediately outlined with a color code.
In addition, the program performs a ring ratio analysis (comparison between central and peripheric responses)
that improves significantly the detection of central alterations.
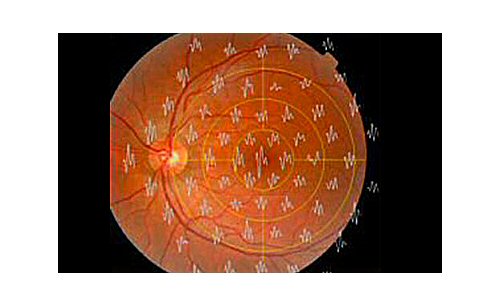
Comparison with the eye fundus
This analysis allows the superposition of the map of local mfERG responses over the image of the eye fundus of the patient. The image of the eye fundus is imported as an image file either through the computer network or by USB key, CDROM etc. The operator identifies the position of the fovea and papilla to obtain a precise superposition.
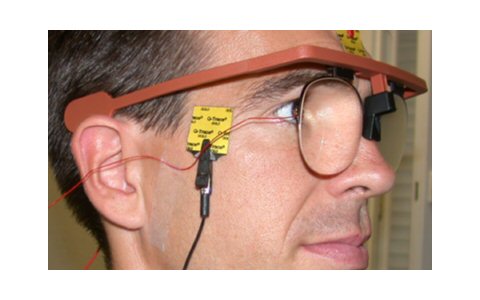
Optical correction and fixation monitoring
The accurate correction of refractive errors is important for the quality of MfERG results
Metrovision proposes set of "large field" eye glasses that avoid masking artifacts of the peripheral visual field.
In addition, the high resolution video camera allows an accurate control of fixation by the operator.
As an option, Metrovision proposes an automated fixation control that analyses the image of the eye in realtime to reject
responses in case of blink and eye movement.
Clinical examples
READ MOREClinical examples of multifocal ERG
Bibliography and references
PDFEvaluation of quantitative indexes for the analysis of multifocal ERG
PDFThe clinical applications of multifocal electroretinography: a systematic review
PDFMultifocal electroretinography in hydroxychloroquine retinal dysfunction
PDFMultifocal ERG using ERG-jet and Gold Foil electrodes in normal subjects
PDFMultifocal electroretinogram in normal subjects: correlation with OCT
PDFIntravitreal Bevacizumab injestion in diabetic macular edema
PDFMultifocal electroretinogram in clinically significant diabetic macular edema
PDFMultifocal electroretinogram in eyes with central retinal vein occlusion
PDFMultifocal Electroretinogram in Birdshot Chorioretinopathy
PDFMultifocal electroretinography in type 2 idiopathic macular telangiectasia
PDFFollow-up of intravitreal injection of Bevacizumab for macular edema in retinal vein occlusion
PDFCentral retina following intravitreal injection of Bevacizumab for treatment of macular edeman
PDFMultifocal electroretinogram in Birdshot chorioretinopathy
PDFMultifocal electroretinogram in subjects with age related macular degeneration
PDFIs multifocal electroretinogram an early predictor of glaucoma?
PDFFive years trend for MfERG in patients with Birdshot chorioretinopathy
PDFMfERG in sickle cell maculopathy
PDFMfERG in cannabis users