Metrovision's contrast sensitivity tests
- Home
- Visual functions tests
- Visual psychophysics
- Contrast sensitivity
Introduction
The evaluation of the contrast sensitivity function presents much more sensitivity than the "standard" visual acuity measurements in alterations of ocular media transparency and diseases of the retina and the optic nerve.
The contrast sensitivity test is useful in several clinical applications:
• the pre and post op evaluation in cataract and refractive surgery
• the evaluation of visual aptitudes.
Methodology
This test is available on the MonCv3 and MonPackONE systems.
The tests are sinusoidal gratings whose parameters (luminance, contrast, spatial frequency) are controlled by the computer.
Each grating is first presented with very low contrast, then the contrast is progressively increased.
The patient presses a button when he/she detects the grating bars.
The test is usually performed under photopic conditions (average lumiannce of the grating=80 cd/m2).
• On the Moncv3 system, it can also be performed under low mesopic condition with the use of specific goggles
that bring the average luminance down to 0.08 cd/m2
• On the MonpackONE system, thanks to its unique LED backlight technology, the everage luminance can be set to any level
from 0.08 up to 80 cd/m2.
Analysis of results
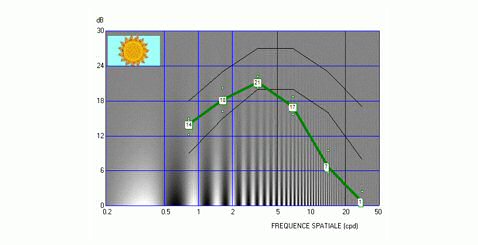
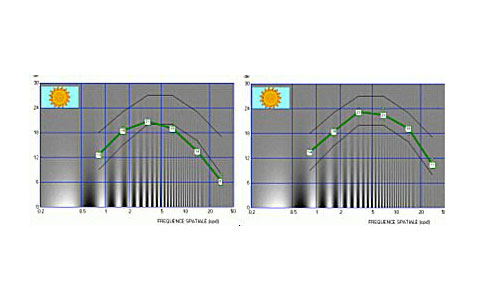
The results of the exam are represented as a curve (here in red) giving the contrast sensitivity versus spatial frequency.
The response curve from a normal subject shows a maximum for medium spatial frequencies (around 3 cycles per degree, corresponding
to 3 white bars plus 3 dark bars viewed under an angle of 1 degree).
The highest spatial frequency perceived at maximum contrast is around 30 to 45 cycles per degree.
The result curve can be compared to normal limits
(here in light grey)
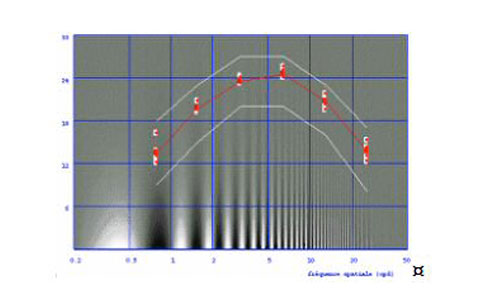
Example of clinical application -1
Contrast sensitivity curve before and after YAG laser capsulotomy
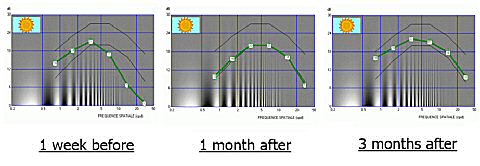
Example of clinical application -2
Contrast sensitivity curve before and after LASIK on high myopia
Recent references
PDFAnwar versus Melles deep anterior lamellar keratoplasty for keratonconus.
PDFEffect of contrast sensitivity and wavefront aberration improvements on the quality of daily vision
PDFDeep anterior lamellar keratoplasty versus penetrating keratoplasty for keratoconus
PDFConventional versus custom ablation in photorefractive keratotomy
PDFPsychophysical and electrophysiological testing in ocular hypertension
PDFMeasurement of corneal aberrations for customization of IOL asphericity: impact on quality of vision after micro-incision surgery.
PDFVisual acuity and contrast sensitivity: AcrySof ReSTOR apodized diffractive versus AcrySof SA60AT monofocal IOLs